
Pingdeck — API Testing & Uptime Monitoring Platform
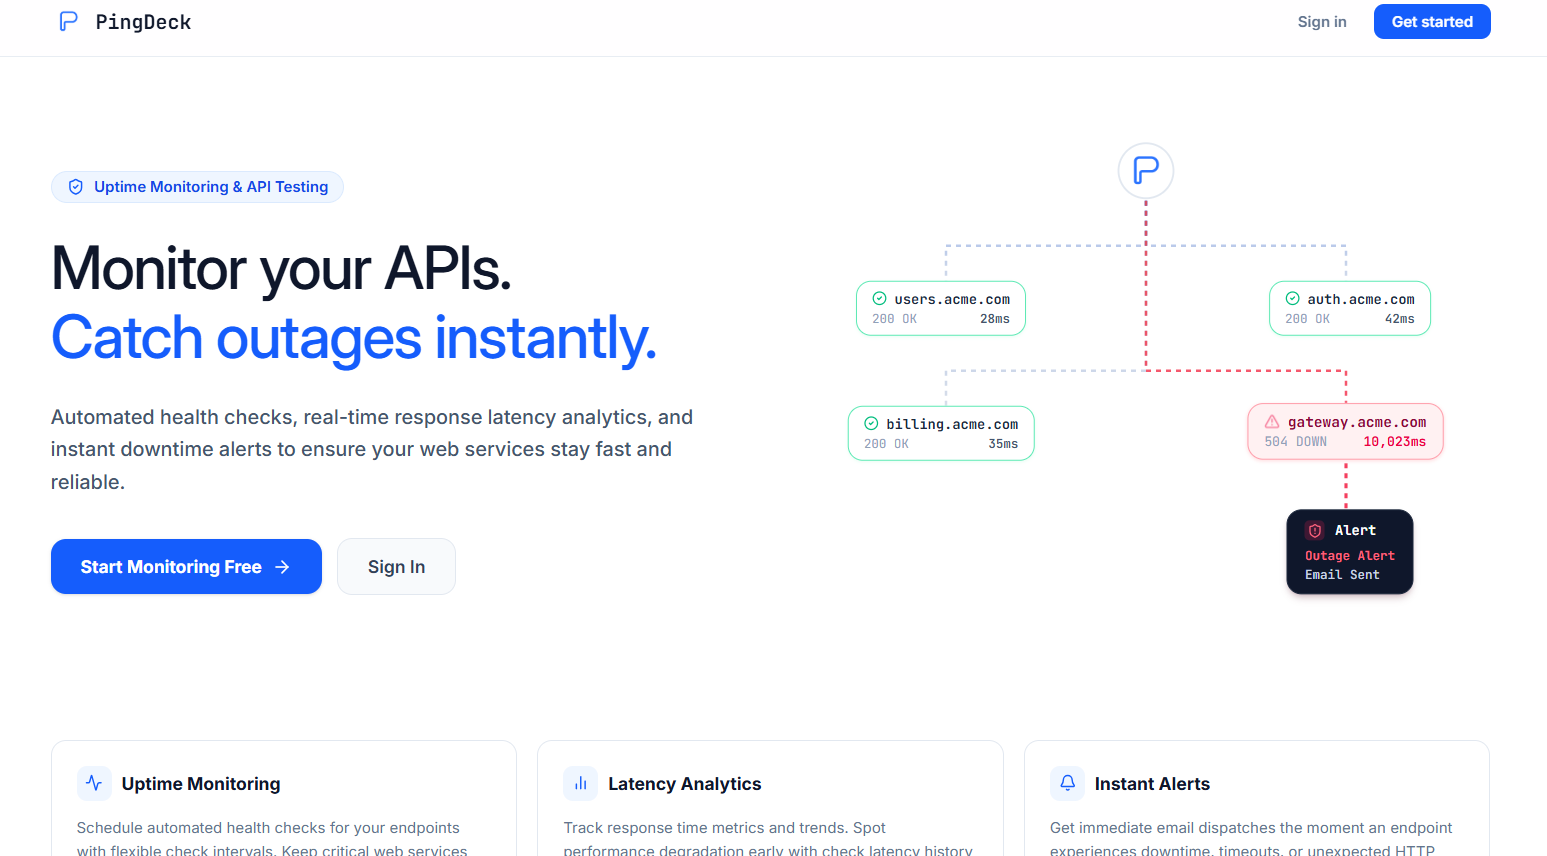
A decoupled microservices-based API monitoring and uptime tracking platform featuring distributed alerting queues, Promtail/Loki container logs, and Prometheus metrics telemetry.
Technologies Used
 TypeScript
.svg) React
React Node.js
 Express
 BullMQ
 Redis
Redis PostgreSQL
 Prisma
 Docker
 AWS
AWS Nginx
Nginx Prometheus
 Grafana Loki
 k6
k6An API testing and uptime monitoring tool that lets developers configure scheduled health checks, track response latency, and receive instant downtime alerts without slowing down the web app.
Core Challenges Addressed
- Reliable Background Checking: Scheduling health checks across multiple endpoints at high frequency without bottlenecking the main API.
- Session Persistence: Simulating authenticated client sessions with cached cookies across check runs.
- Container Observability: Collecting clean metrics and logs from containerized workers with minimal overhead.
Key Features & Technical Implementation
1. Decoupled Uptime Engine
- Instead of executing health pings directly from the HTTP server (which blocks the Node.js event loop with heavy network I/O), Pingdeck uses Redis and BullMQ to manage jobs.
- The scheduler inserts repeatable cron configurations, and worker threads consume them concurrently.
- If an execution fails, it is automatically retried with exponential-backoff delay and isolated from primary queues.
2. Prometheus Telemetry & Observability Pipeline
- The worker engine is instrumented with prom-client to measure health in real-time.
- Exposes custom metrics on a dedicated port tracking jobs_processed_total and latency histograms (job_execution_duration_seconds).
- In production, Pino logger outputs structured JSON logs. A Promtail daemon scrapes /var/run/docker.sock to dynamically parse and ship nested JSON attributes to Grafana Loki.
3. Stateful Cookie Session Persistence
- To support testing APIs requiring dynamic logins, the worker retrieves a serialized CookieJar cached in Redis before pinging.
- Proactive Healing: If cookie TTL falls below 2 × check interval, it automatically refreshes cookies in Redis before running the monitor check.
- Reactive Healing: If a ping fails with a 401 Unauthorized, it invokes the auto-login flow, updates the cache, and replays the request immediately to avoid false-positive alerts.
Problems & Engineering Solutions
Challenge 1: Cross-Site Cookie Ingestion (ITP) on Mobile Browsers
In early deployments, mobile browsers (iOS Safari/Chrome) blocked the HTTP session cookie because the frontend was hosted on Vercel (.vercel.app) and the API backend was on a different server (.duckdns.org). The browser flagged it as a third-party tracking cookie and discarded it, throwing 'Unauthorized - no token' errors.
Configured Nginx on EC2 and vercel.json rewrite routing to mount the API on a relative path (/api/) on the frontend. Since the browser interacts only with a single origin, the auth cookies are treated as secure, first-party cookies and save successfully.
Challenge 2: Redis Store Rate Limiter Failures in Fallback Mode
High-traffic testing triggered brute-force limits. When Redis was busy, the rate-limit-redis client threw errors due to mismatch command signatures in standard ioredis calls, crashing the app.
Implemented a custom FallbackStore wrapping the Redis store. If Redis throws a connection error or command mismatch, the wrapper gracefully falls back to a clean memory map (Map<string, { count, resetTime }>) with automatic expiration cleanup, keeping the API online.
Performance Benchmarks
API Gateway Throughput (k6 Load Test)
50 concurrent virtual users executing persistent endpoint queries in a tight loop for 60 seconds.
Sustained throughput of 64.34 requests/second at 0.00% error rate and a stable p95 latency of 107.83ms.
Queue Execution Throughput (BullMQ benchmark)
1,000 health check requests added to Redis as a single bulk write.
The background worker pool processed, executed, and wrote response results back to PostgreSQL at a rate of 124.94 jobs/second (over 7,500 active monitors/minute).